
Operation of each logging conditions and treatment of the measured value of the instrument
I will explain the measurement interval of the instrument, handling of measurement by the sensor full scale, the differences between logging operation by logging conditions.
Measurement interval
This is the timing to update the value of body liquid crystal display by obtaining the gas concentration is measured. Once a second in the state where no logging in the instrument, I'm going once measured two seconds while logging. The reason for the difference of two seconds and this one second has been set at one second shorter interval for performing manually span calibration and zeroing in the state in which two seconds, not logging longer interval to reduce current consumption in logging in .
Handling of the value measured by the sensor full scale
Showed how are treated measurements by the sensor full scale 100ppm, 500ppm, 1000ppm of when the gas concentration was varied as shown in the graph below as an example. Measurements at each full scale is shown in Figure 1 below in the table below. 1000ppm sensor has a measurement value of 0ppm to no more than 10ppm of minimum resolution between 0-26 seconds elapsed time. Minimum resolution smaller values are treated rounded to a lower value side in this way.
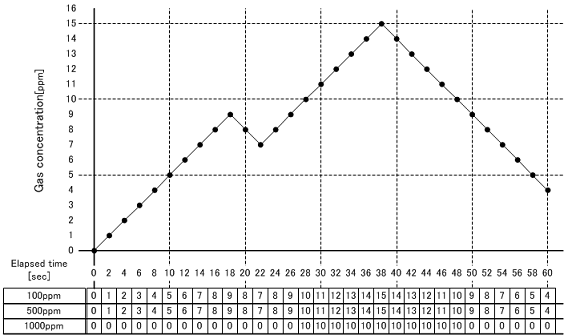
Figure1. The measurement results due to the difference of the sensor full scale of the instrument and gas concentration
Difference in the resolution by the sensor full scale
Difference in the minimum resolution of the sensor full scale is in Table below.
| Full scale[ppm] | Sensor Model | minimum resolution[ppm] |
|---|---|---|
| 10 | H2S-520E | 0.1 |
| 100 | H2S-521E | 1 |
| 500 | H2S-522E | 1 |
| 1000 | H2S-523E | 10 |
| 3000 | H2S-524E | 25 |
Operation of each logging conditions
There are four types of real (REAL), minimum (MIN), maximum (MAX), average (AVE) logging conditions. Shows the measurement results for each logging conditions if you change gas concentration is as shown in the graph in Figure 2 below as an example. In this example, I have one minute the sensor full scale 100ppm logging interval.
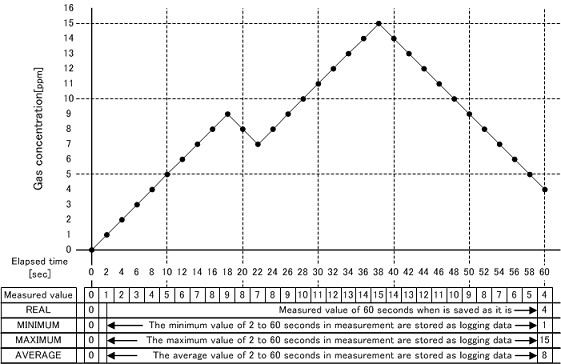
Figure2. Difference of logging data by logging conditions
The information about the data calculated in the case where the average logging conditions
Average values are calculated the average value of all the data in the logging interval. Measurement interval because it is two seconds, for example, we have calculated the average of 150 data in the case of 5 minute logging, the average of 30 data inteh case of 1 minute logging. In the case of Figure 2, we have divided after 30 to the sum of the measured data of 30 to 60 seconds from 2 seconds elapsed time. It becomes 8.3667 Dividing by 30 this total of up to 60 seconds from the second becomes the 251, but will be saved as a truncated 8 [ppm] a decimal point as logging data. Truncated value of the average value at the time of calculation will be rounded down to the decimal point all of the full-scale other than 10ppm as the following table by each sensor full scale.
| Full scale[ppm] | Sensor Model | Average value calculated data handling | Minimum value[ppm] |
|---|---|---|---|
| 10 | H2S-520E | Second decimal place truncated | 0.1 |
| 100 | H2S-521E | Decimal point truncated | 1 |
| 500 | H2S-522E | Decimal point truncated | 1 |
| 1000 | H2S-523E | Decimal point truncated | 1 |
| 3000 | H2S-524E | Decimal point truncated | 1 |
- Top page
- ANASYS on Windows 11
- Unsupported OS
- Notes of GHS-8AT external case when mounting
- Download
- Download and installation instructions
- Download and unpack the USB driver
- Driver installation method
- Troubleshooting / QandA
- Operation of each logging conditions and treatment of the measured value of the instrument
- Version up contents